On Tuesday April 19th, Secretary Clinton won New York by 16 points, further cementing her lead and pushing her closer to the nomination. The Sanders campaign has continued to press on claiming that they can win Pennsylvania and try to halt her momentum. With Sanders expected to lose Delaware, Maryland and Connecticut (and win Rhode Island), a win in Pennsylvania could impact the direction of the race. Sanders has treated Pennsylvania as a major part of the race, he even gave his speech on the night of the NY primary here on April 19th showing that while his campaign knew he could not win New York, he would try hard to win Pennsylvania.
Overall, I expect Secretary Clinton to win Pennsylvania due to the similar demographics of New York but I expect a narrower margin (10%-12% instead of 16%) due to the smaller population of the Philadelphia area compared to the New York City population. This will be similar to the margin of her 2008 win where she won by ten points. The map though will be partially reversed from 2008 (in 2008, President Obama won Philadelphia, heavily African American areas and upscale Philadelphia suburbs while Secretary Clinton won strongly in rural and West PA). In 2016, I expect the votes to be partially reversed where Secretary Clinton performs well in Philadelphia, heavily African American and upscale areas while Sen. Sanders plays better (but not winning Secretary Clinton’s 70%+ margins) in rural and West PA.
This article is cross posted at racesandredistricting.blogspot.com/… which has more election maps and analysis. We are also on Facebook at www.facebook.com/...
This is a county by county analysis of Pennsylvania which will predict which counties Secretary Clinton and Sen. Sanders will win.
 Philadelphia Map
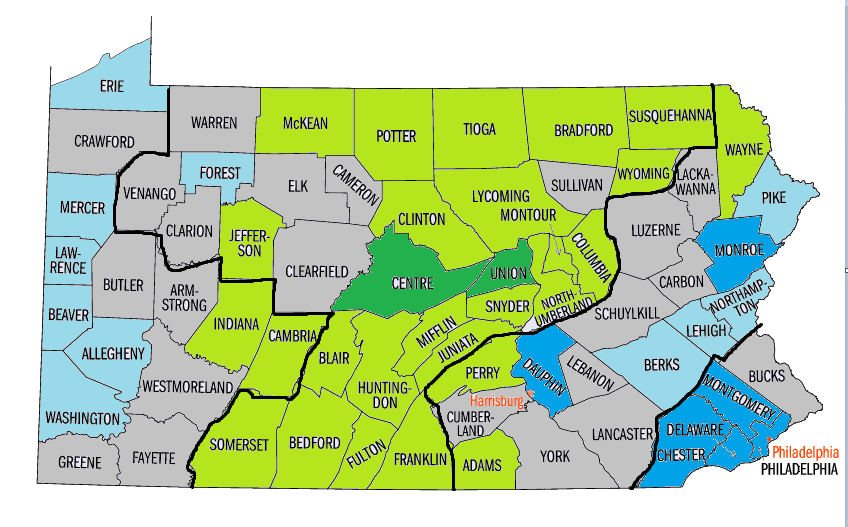
Dark Blue = Strong Clinton
Light Blue = Leaning Clinton
Grey = Tossup/not enough data
Light Green = Leaning Sanders
Dark Green = Strong Sanders
The dark lines represent my divisions between the Philadelphia metro, Eastern PA, Rural PA and West PA.
Philadelphia Metropolitan Area:
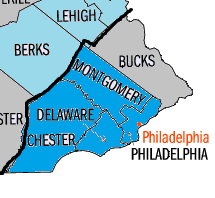 Philadelphia Metropolitan area
With the largest minority percentage in the state, a high population of wealthy white voters and a similarity to New York areas Secretary Clinton won, the Philadelphia metropolitan area should be Secretary Clinton’s strongest area in the state.
Philadelphia:
In 2008, Philadelphia was President Obama’s strongest county in the Pennsylvania primary. In 2016, it will likely be Secretary Clinton’s strongest county in Pennsylvania. The reason is that Philadelphia is 45% African American, 13% Latino and 35% White. With Secretary Clinton’s 75%-25% margin with African American voters in NY and 60% win in Brooklyn with a 34% African American population, Secretary Clinton will likely overperform that 60% number and could win 65% in Philadelphia, a reversal from Obama’s 65% win there in 2008.
Delaware County:
With a generally wealthy population and a 21% African American population, Secretary Clinton should expect a strong win here similar to Westchester County which has similar demographics with upscale white voters and African Americans. Secretary Clinton may not win here 2-1 where she did in Westchester but a 61%-62% win here is very possible. This could be Secretary Clinton’s best or one of her best counties in the state.
Montgomery County:
I expect a Hillary win here due to the similar demographics to wealthy NYC suburbs but with a lower African American population (9%) and a large college aged population (Lower Merion Township). Sanders could keep it narrower here than Delaware County but barring a massive Secretary Clinton collapse he should be unable to win here. The wealthy Democrats as shown in Nassau and Westchester Counties should back Clinton.
Bucks County:
If Sanders carries one county in the Philadelphia suburbs, it will likely be this one. Bucks County is 85% White and has many liberal upscale white voters. It also has more working class voters as well. Still, I expect a Clinton win although I expect it to be narrow.
Eastern Pennsylvania:
 Eastern PA
This area represents the counties west of the Philadelphia metropolitan area and east of the rural areas in the Appalachian Mountains. The cities in this area include: Harrisburg, Reading, Allentown/Bethlehem and Scranton. Secretary Clinton should perform well in these areas (although not as well as the Philadelphia metropolitan area) with help from the growing Hispanic and New York transplant population.
Lehigh/Northampton Counties:
I am grouping these two counties together due to being neighbors and similar in demographics. While Allentown/Bethlehem may appear to Sanders country at first due to being heavily working class towns, they also have a rapidly growing Hispanic population and in Lehigh County, the White population recently dropped below 70% (and the Hispanic population increased above 20%). These demographic changes should allow Secretary Clinton to win here.
Dauphin County:
With an 18.7% African American population (that helped propel Obama to a 58% win here in 2008), Secretary Clinton should perform well here. I expect a 55%-56% here for her. Harrisburg, the capital of Pennsylvania is located here but unlike Albany (which Sanders narrowly won), it has a larger African American population.
Berks County:
After the Allentown area, Berks County is the most heavily Hispanic part of Pennsylvania. I expect Hillary Clinton to play well here, although I do not expect her to win by a large margin.
Lackawanna County:
While Scranton, a heavily working class area could appear to Sanders territory at a first glance, Secretary Clinton has some advantages here. She won 73% in 2008 here, Scranton has demographic similarities to the Youngstown, OH area Secretary Clinton won and her ancestors had roots here, something she highlighted in her 2008 campaign. While Sen. Sanders’s economic message will resonate with many voters here, it may be enough to keep it close but not enough to win.
Monroe County:
This county has had one of the most rapid demographic changes in Pennsylvania in the last couple of decades. Many New York transplants have moved in here and the Hispanic and AFrican American populations have increased to 15% each. The New York transplants moving in though are mostly upscale retirees who are more similar to Westchester County voters than southern Staten Island voters so they are more likely to support Secretary Clinton. The demographic trend is similar to a lesser extent in nearby Pike County as well.
Rural Pennsylvania:
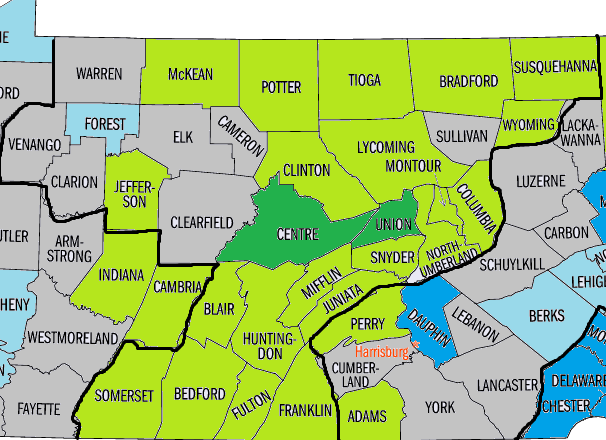 Rural PA
James Carville once said, “Pennsylvania is Philadelphia in the East, Pittsburgh in the West and Alabama in the middle.” Central Pennsylvania may not have a large African American population similarly to Alabama but may be similar in other ways. One of the ways it is not similar though is in Secretary Clinton’s margin. She won Alabama with 78%, that will not happen here. This is Sanders’s best chance to win a region of Pennsylvania. I expect the votes in this area to be more similar to central rural Upstate (strongly pro Sanders) than to Ohio or western New York (narrowly pro Secretary Clinton). I listed many of the rural PA counties as “leaning Sanders” because most of the Upstate counties bordering PA supported Sanders but by narrow margins so I expect the central rural part of the state to vote roughly 54%-55% Sanders.
Centre County:
This could be Sen. Sanders’s best county in Pennsylvania. It is home to “State College” where Penn State is located and has a large rural population as well. There is a little diversity but Sen. Sanders’s strength with young voters should give him a win of around 60% here.
Sullivan County:
Secretary Clinton has the potential to pull off an upset here. The reason is that 27% of the county’s population is 65+ and polls such as NBC/WSJ/Marist and Monmouth show her leading 66%-28% among 45+ voters and 57%-33% respectively among 65+ voters respectively giving Secretary Clinton a chance to win rural counties such as Sullivan County.
Pittsburgh/West Pennsylvania:
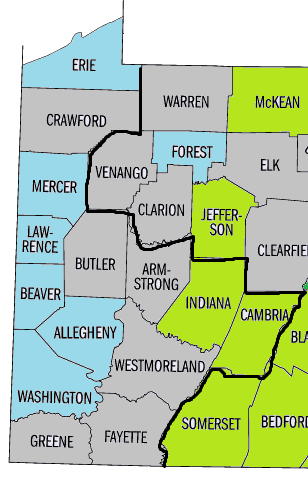 West PA
Western Pennsylvania should vote similarly to eastern Ohio and western New York. As shown by the numbers in Ohio and Western New York, western Pennsylvania will most likely be close but I expect a narrow Clinton win here. The reason is that although Sanders did win most of western New York, his margins in Chautauqua County and Niagara County were narrow. These eastern Ohio results show that Secretary Clinton appears to do better in more urbanized working class areas while Sen. Sanders appears to do better in more rural ones as shown by Central New York. Also, the 65+ percentage of the population is higher here than in most Upstate counties. Central New York also has many similarities to Vermont, Sen. Sanders’s home state. Furthermore, many of the West PA Democrats tend to be more conservative than the rural Upstate voters who are more liberal.
Allegheny County:
With a 13% African American population and a small but growing base of wealthy white voters, Secretary Clinton could win here with a 10%-12% margin. Similarly to the 2008 primary, I expect Allegheny County’s results to mirror the state’s. With an African American population of 13%, working class white voters and upscale white voters, Allegheny County is a good representation of the state in the Democratic primary.
Erie County:
The Erie County in New York (with Buffalo) voted for Secretary Clinton by one point. Erie County, PA should be close as well with bordering Chattaqua County in NY voting for Sen. Sanders by eight points and Ashtabula County on the west voting for Secretary Clinton by 10 points. Overall, I expect a narrow Secretary Clinton win here but I would not be surprised if Sen. Sanders won here.
Conclusion:
Overall, I predict another Secretary Clinton win in PA, this time by 10-12 points.
Philadelphia area: Secretary Clinton wins Philadelphia overwhelmingly, wins all the suburbs with Bucks County being close.
Eastern Pennsylvania: Secretary Clinton wins most urban areas, she wins strongly in the Harrisburg area but might lose the Scranton area.
Rural Pennsylvania: while Sanders is likely to win, look for upsets in counties that are 20%+ 65 and older such as Sullivan and Forest Counties.
Western Pennsylvania: Secretary Clinton is likely to carry it due to the higher percentages of older voters than in Upstate New York and demographic similarity to Ohio counties that she narrowly carried.

